

DEW #155 - Gems from the 2026 Trenches
A lookback on my favorite gems :)
Welcome to Issue #155 of Detection Engineering Weekly!
This week, I’m resurfacing some of my favorite Gems over the last five months. We’ll be back to our regularly scheduled newsletter starting next week!
✍️ Musings from the life of Zack:
I’ve officially christened yard work shoes with an old pair of white sneakers. I just need some cargo pants, a cell phone clip attached to my hip, and a Bluetooth headset to really complete the outfit
I saw my friends playing Slay the Spire 2 on Steam, so I got it, and it’s so addictive! You know it’s bad when you think about game mechanics on your drive to the gym or between work meetings
Proud Dad moment: my daughter had her first-ever ballet recital, and she crushed it. She was in an auditorium with over 100 people, and she was in the youngest age group. She was all smiles and even found us in the crowd and waved

Detection Pipeline Maturity Model by Scott Plastine
I’m a huge fan of maturity models, and in the early days of my writing, I frequently referenced the work of Haider Dost and Kyle Bailey when discussing the maturity of detection engineering programs. As this space matured, technology matured with it, and we now have complex systems within each part of the Detection Engineering Lifecycle. So, to me, it makes sense that we now have folks like Plastine helping us understand what it means to measure the maturity of a Detection Pipeline.
Plastine outlines six different levels of maturity, starting with a classic favorite, no maturity! This involves having a security tool stack with no centralization, and analysts have dozens to hundreds of Google Chrome tabs open which gives me anxiety. The fundamental issues Plastine outlines and continues to improve here include:
Several security tools with their own alerting and detection systems
The need to log into and investigate each alert on each individual tool, so managing screen sprawl
The analyst manually building cases in some case management or ticketing tool, such as JIRA or ServiceNow
The next maturity step, Basic, addresses some of these issues by essentially placing the Case Management tool between the tools and the analyst, rather than being out of band. As maturity levels progress, so does the architecture of this setup. For example, the “Standard+” architecture has a much saner pipeline setup:
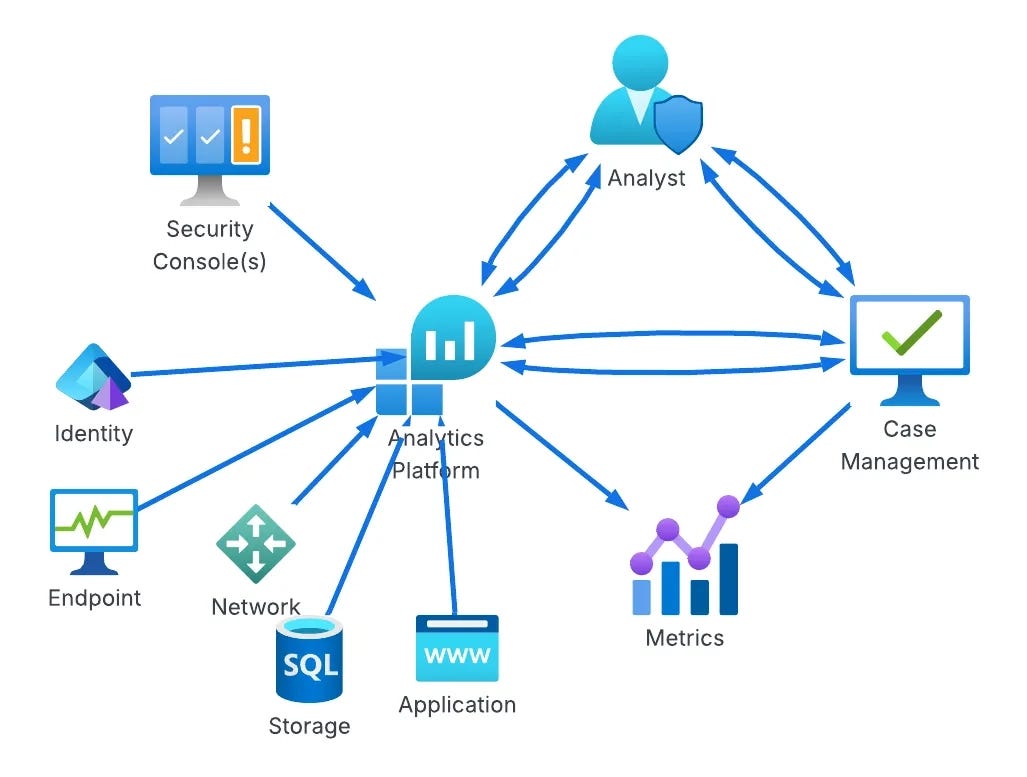
The cool part at this point in the maturity journey is switching from architecture improvements to more advanced concepts in the analytics platform. Custom telemetry, log normalization, and a risk-based alerting engine ideally surface only relevant alerts and reduce false positives. Teams begin to build composite rules, leveraging commercial detections alongside their own internal detection and risk alerting systems, and they all take advantage of learning from their data to inform their rule sets, not just their environment.
This diagram drove it home for me, and became my favorite:
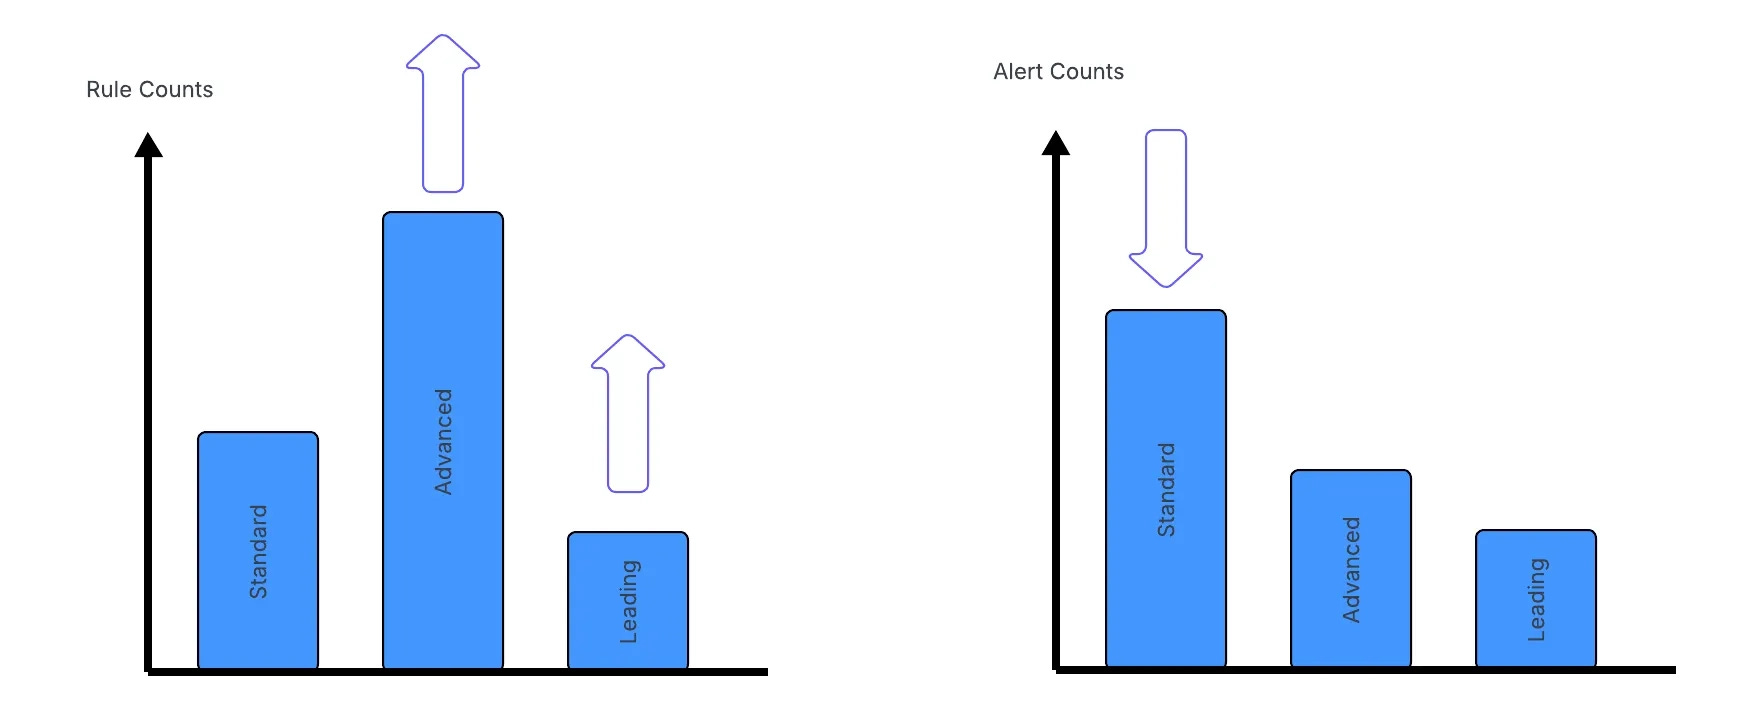
As you progress through maturity, the trap teams fall into is more rules is better. I think the measure of a Leading detection function is reducing rule count thereby reducing the complexity of managing rule sprawl.
Plastine posits that this can be achieved by using data-science-based rules, risk-based detection, and leveraging as much entity-based correlation as possible.

TTPI’s: Extending the Classic Model by Andrew VanVleet
Tactics, Techniques & Procedures (TTPs) is a table-stakes term in our industry. It binds our understanding of attacker behavior into a common lexicon. Within this lexicon, MITRE ATT&CK reigns supreme, and they have some generally agreed-upon definitions within their ATT&CK FAQ. Basically, in order to understand MITRE ATT&CK, you have to understand their nomenclature of TTPs, where:
Tactics describe an adversarial objective, such as initial access
Techniques describe how an attacker can execute some operation to achieve that objective
Procedures describe the implementation details of a technique in a given environment
In this post, VanVleet challenges this model because the specific details of how an attack is carried out at the Procedure level can sometimes be vague. I think this is by design on MITRE’s part, because the procedure to achieve it can differ depending on the environmental context I mentioned earlier. He makes the analogy that Procedures are like a cake, not necessarily a recipe. He proposes the concept of Instance, which is the recipe itself, to achieve that procedure.
ATT&CK does get close to this via Detection Strategies. As an example, VanVleet looks at T1070.001, Indicator Removal: Clear Windows Event Logs. The MITRE page includes a description of how this can be achieved, but it seems high-level enough that some more detail on the recipe would be helpful. The detection strategy can provide more clues from an event-ID perspective, but without the technical implementation, it may be hard to recreate and test. Here’s his idea of what an Instance section could look like:
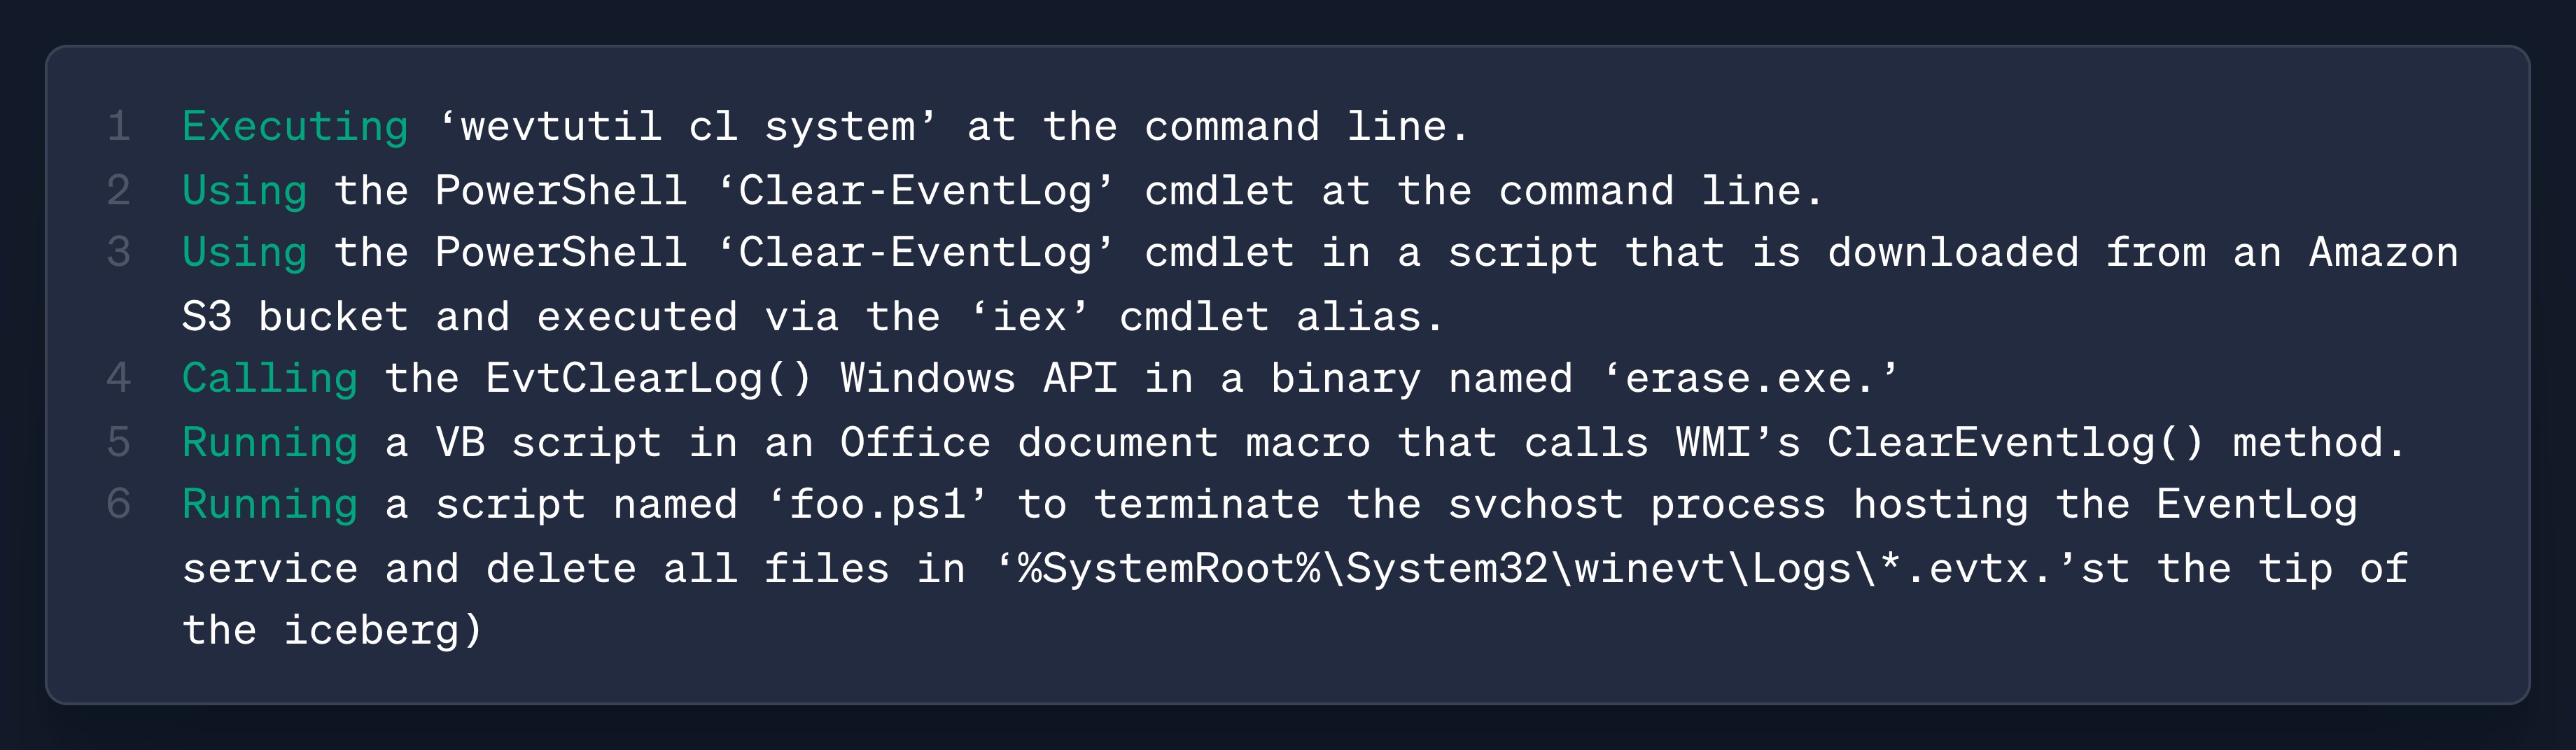
This could be helpful for detection engineers who want to recreate the attack in their own environment to test their telemetry generation and detection rules.
I’ve always had a hard time with the Pyramid of Pain for this exact reason. The “TTPs” part at the top of the Pyramid can encapsulate so much work, without any ability to reverse-engineer how the attack is captured. In fact, I’ve always thought TTPs/Tools should be combined, because almost every Procedure contains some level of tooling to capture the attack.
In the spirit of alliteration, and perhaps more as a thought exercise, he proposes the “Pyramid of Permanence”.
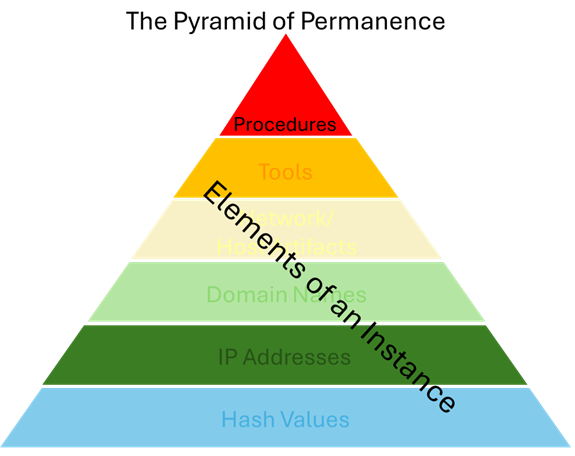
Basically, Procedures are what we want to capture, and everything below the tip of the Pyramid are Instances that supports the procedure. It’s an interesting thought experiment, and as long as it serves as a lexicon to drive the conversation on better modeling, I’m all for it.

Centralized Suppression Management for Detections Using Macros & Lookups by Harrison Pomeroy
Detection rule efficacy is the practice of curating rule sets that balance precision, recall, and the cost of triage. New detection engineers typically think about rules being the only place you can apply logic to help manage this balance. A more precise query that accounts for benign behaviors, given the tactic or technique, can increase the likelihood of capturing true positives. But there are other capabilities in SIEM technologies and software engineering practices that can perform filtering and suppress alerts in more dynamic, context-aware ways that align with the threat landscape or your environment.
This post by Harrison Pomeroy details the power of Splunk’s macro and lookup table functionality to perform suppression of alerts without re-deploying rules. A suppression is a concept in which detection engineers deploy a capability to dynamically mute alerts, thereby reducing the cost of both false-positive generation and the subsequent need to tune a rule on small fields. It also makes the rule more resilient because it can account for external factors related to benign behaviors, such as known service accounts, scheduled tasks, or internal tooling.
Harrison leverages Splunk’s macro and lookup table features to achieve this.
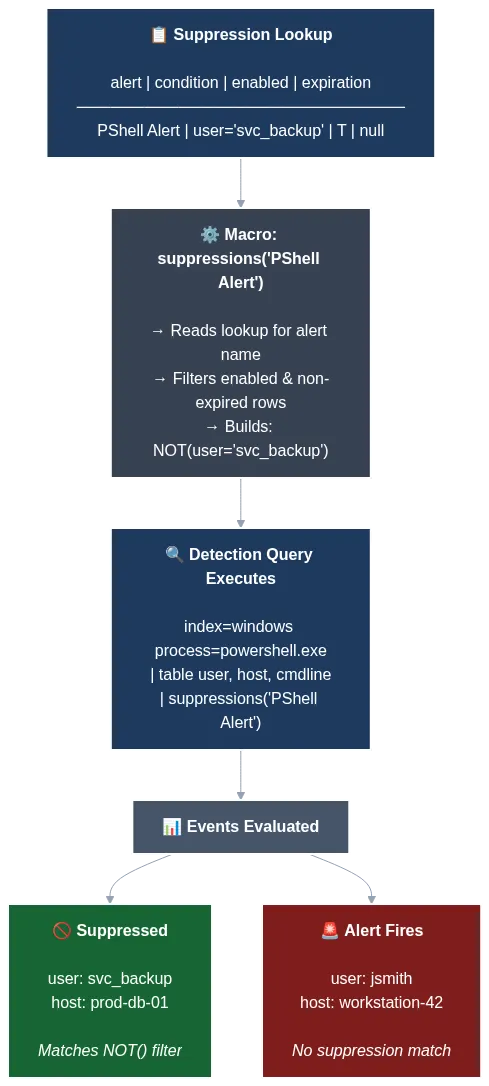
The above Mermaid diagram shows his really clever setup. When you apply macros to each of your Splunk rules, you can start bringing in logic to evaluate whether suppressions are enabled for the rule (the T value), and then specify a lookup table to find additional alert logic to append to your original rule to suppress false positives.
The above example suppresses alerting on any user called svc_backup. The macro executes based on the T value and performs a lookup in a table relevant to the PShell Alert rule. svc_backup is in the table and uses a NOT() filter to prevent an alert if svc_backup is present. The suppressed green box ensures the alert doesn’t fire, and the Alert red box fires because the user is jsmith.
This type of suppression occurs at query time, before the alert is generated. There are other suppressions you can apply before a log hits the index, or after the alert fires. This is a great topic for my Field Manual series, so thank you, Harrison, for the inspiration!
👉️ Read Online if Clipped 👈️

The Detection Engineering Baseline: Hypothesis and Structure (Part 1) by Brandon Lyons
Baselining is an overused term in this field because, at least in my experience, it’s a hand-wavy marketing term. You’ll read about a product that’ll perform baselines of your behavior and environment, and it’ll alert you if it detects something abnormal or outside that baseline. In practice, this works, but the opaqueness of some of these methods makes it hard to understand how it happens.
This is why posts like Lyons help cut through the opaqueness and show the receipts of how to do this in practice. And to be honest, it’s nothing groundbreaking, only in the sense that the concepts Lyons proposes here are part of entry-level statistics literacy. Which is why I’m pretty opinionated on the engineer of detection engineer. Don’t get it twisted: although the concepts in this post are entry-level statistics, understanding the application requires deep security expertise.
Lyons lays out a 7-step, repeatable process to establish a detection baseline, quoted here:
Backtesting of rule logic: Validate your detection against historical data before deploying
Codified thought process: Document why you chose specific thresholds and methods
Historical context: Capture what your environment looked like when the baseline was created
Reproducible process: Enable re-running when tuning or validating detection logic
Foundation for the ADS: Feed directly into your Alerting Detection Strategy documentation
Cross-team collaboration fuel: Surface insecure patterns and workflows with data-backed evidence
Threat hunting runway: When alert precision isn’t achievable, convert the baseline into a scheduled hunt
This process succinctly captures a well-thought-out detection process. Without data, how can anyone possibly deploy detections that will fire? Without context around that data, how can anyone possibly believe the rules that are firing outside of the baseline?
They step through the 7 steps here using a CloudTrail API example. Basically, Lyons tries to map out what anomalous behavior looks like for CloudTrail access across an environment. The statistics section focuses on a modified Z-Score. Here’s the rundown:
Security metrics (API calls per day, login attempts per hour, file accesses) approximate a normal distribution (a bell curve), especially when aggregated over time. This means that:
Most values cluster around the median (middle value)
Extreme values become increasingly rare as you move away from the center
The distribution is symmetric
To establish a baseline, Lyons collects historical data, such as 30 days of activity, and computes two key statistics:
Median - the middle value
MAD (Median Absolute Deviation) - measures spread around the median
When a new value enters your queue, you compute the Modified Z-score, which is the distance-via-standard-deviation of that value from the median. Modified Z-score is really good at capturing outliers, versus the regular Z-score, which focuses on standard deviations from the mean, and can be sensitive to outliers.
An outlier can be, according to Lyons, creating administrative credentials at 3am to an abnormal amount of S3 bucket accesses, perhaps used for exfiltration. Here’s a graphic I prompted Claude to create to drive this point home:
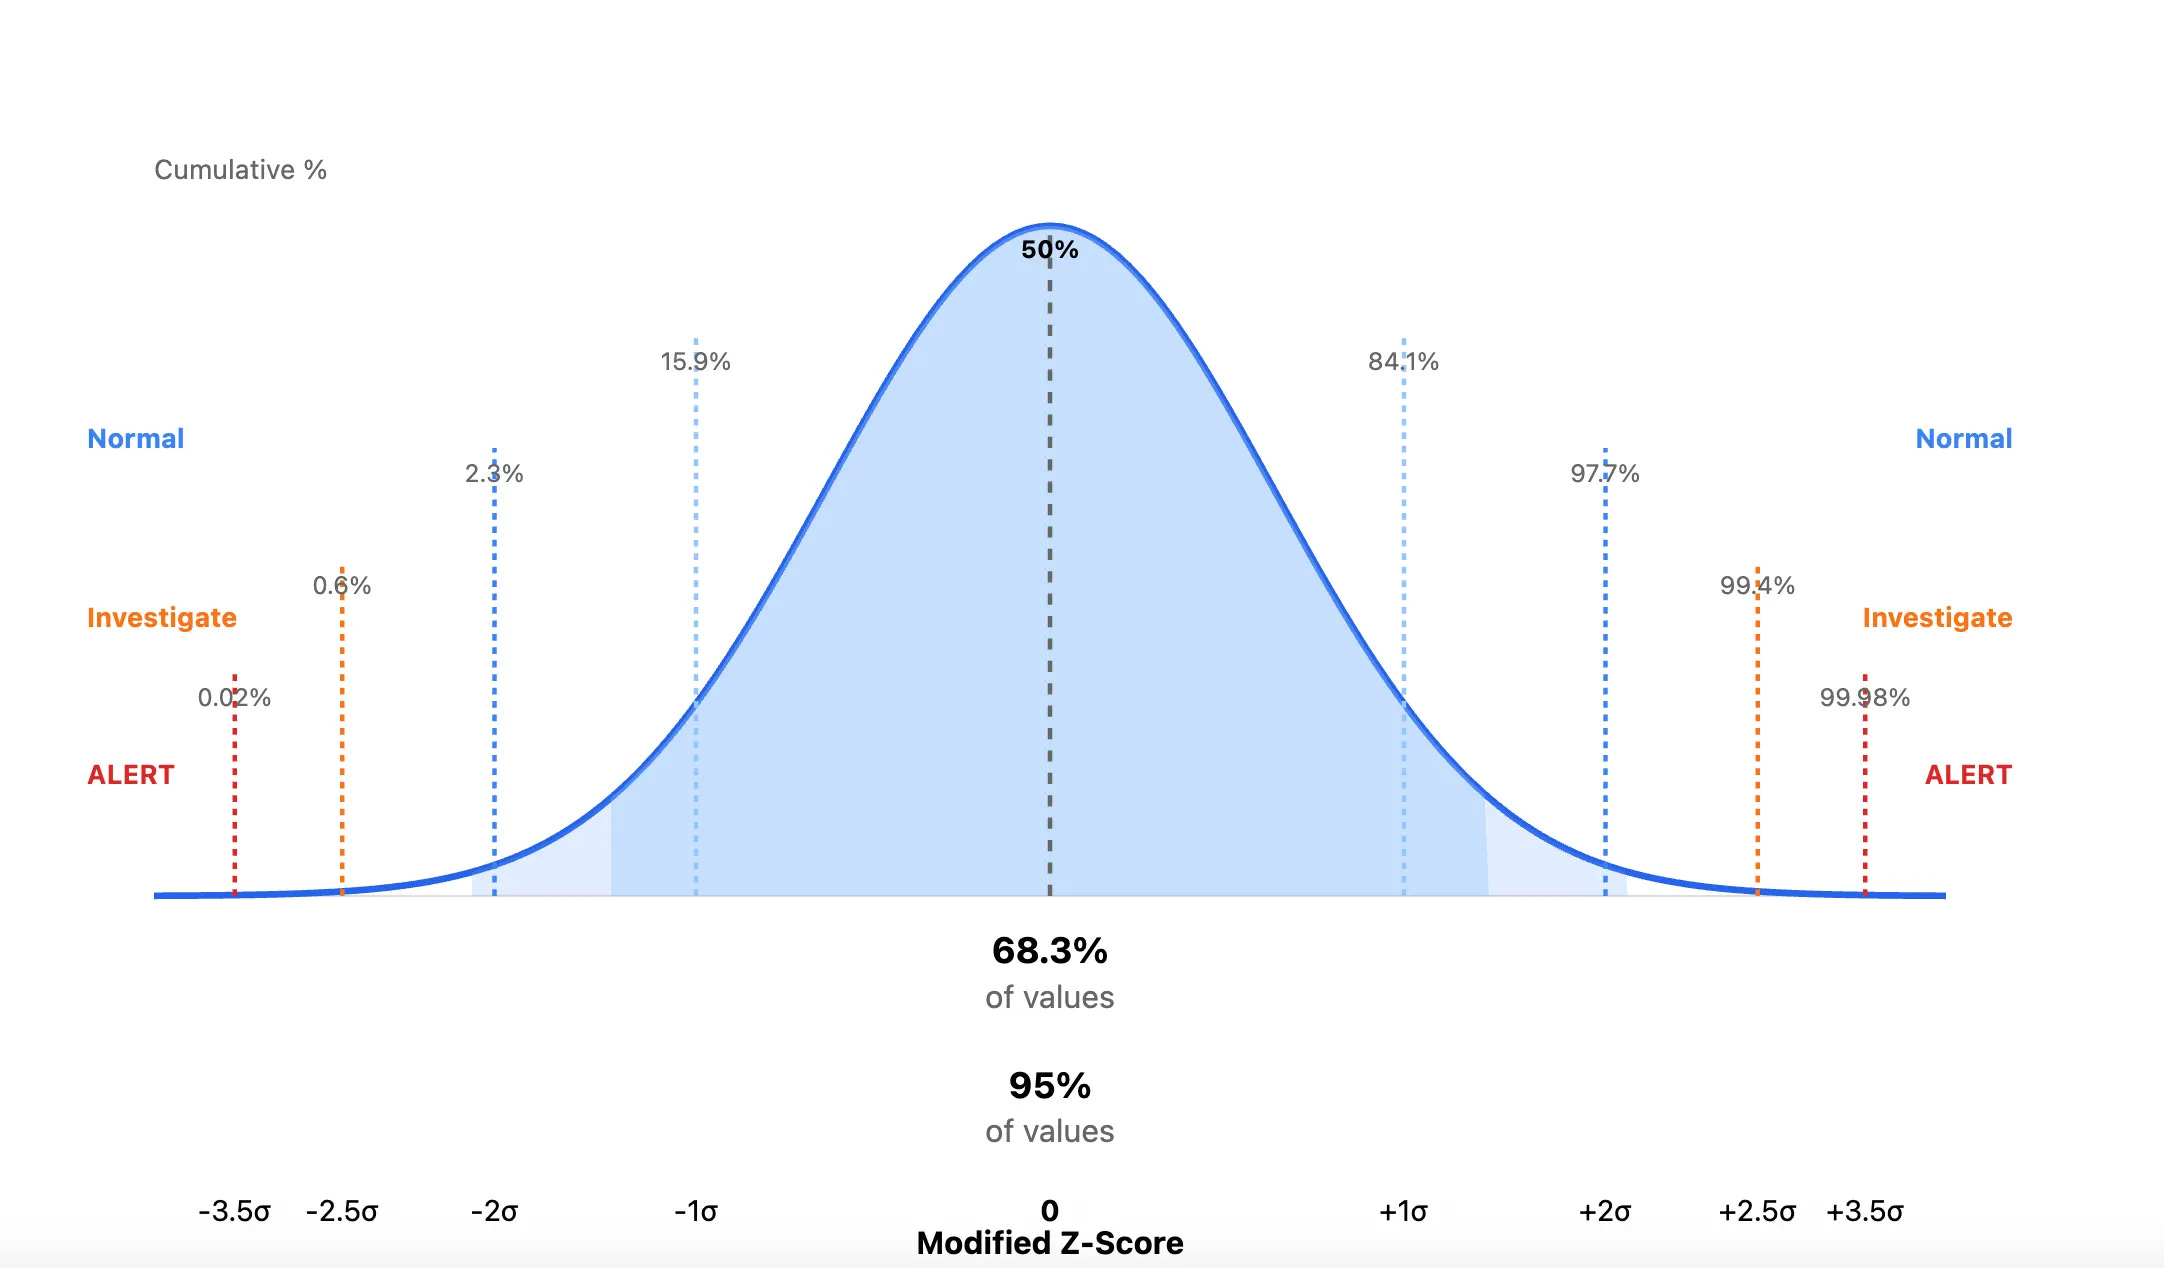
This type of rigor removes the guessing game about whether events are absolute measurements. Is 1000 API calls weird, or is 100? Is 10 pm an acceptable window for Administrator access, or is 5 pm? By looking at the standard deviations away from the median, you focus on relative measurement. It removes the human judgment about the absolute weirdness of an event, and whenever you remove a human from a large data problem, you get a bit closer to sanity.
Lyons created a follow-along Jupyter notebook with synthetic data to recreate the measurements in his blog.