

Det. Eng. Weekly #119 - Gems from the 2025 Trenches, Part 1
These gems are hopefully rare.

Welcome to Issue #119 of Detection Engineering Weekly!
This is Part 1 of 2 series on Detection Engineering Gems I’ve posted since the beginning of the year.
💎 Detection Engineering Gems 💎
January 8 Issue
The (Anti-)EDR Compendium by Dobin Rutishauser
What is the architecture of an EDR, a massively effective security tool? Well, it’s hard to say. EDRs are kept trade secrets by the respective “big” EDR companies. Elastic is seemingly the only one where you can get documentation on architecture. Yet, I've always yearned for something like this compendium from Rutishauser: a massive deep-dive on Windows security concerning EDRs, with links and references to back up the research.
I won't lie: this is a massive post full of technical details. It took me coming back and reading 4 to 5 times over two days while taking notes and jumping back and forth to let the information soak in. But this is worth reading and bookmarking for Windows security.
There's lovely ASCII art accompanying most of the concepts. It reminds me of those old-school Operating System zines for Linux that I used to try to write crappy C code for Linux kernel rootkits.
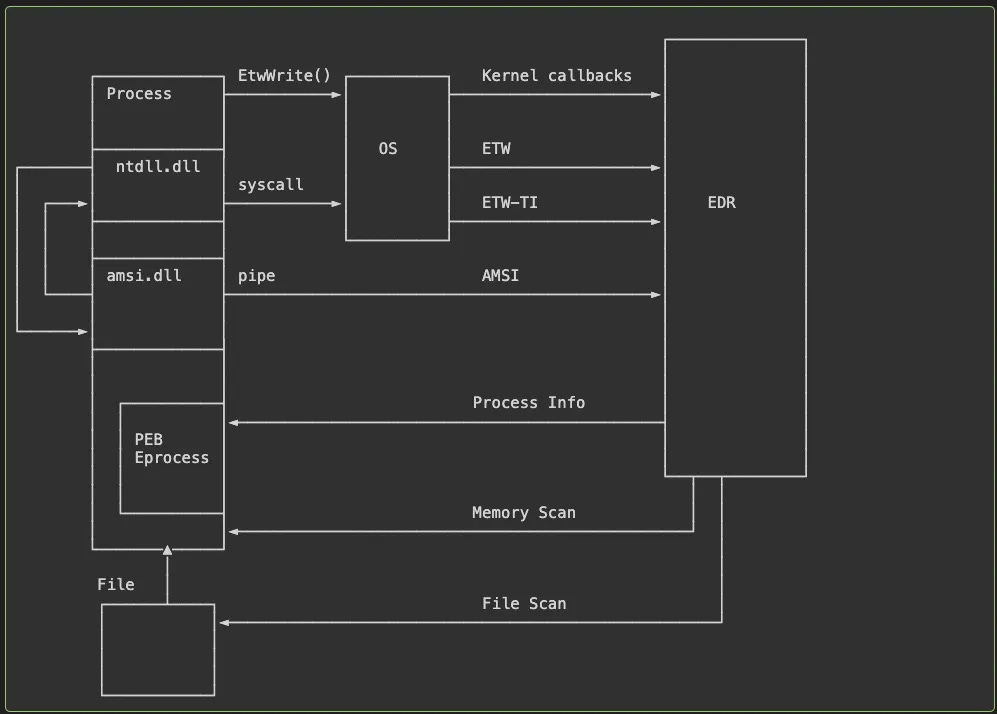
The blog is split into three parts: Intro, EDR Detection and EDR attacks. EDR detection has fantastic, technical Operating Systems deep dive on how EDRs generally work, via the “Bubbles of Bane” model. Rutishauser introduces three different ways you can do EDR detection on Windows. It was nice seeing how loading an EXE into memory and where the EDR investigates the process via user-mode and kernel hooks, enriching via querying the kernel, and more intensive operations such as running tools like YARA over memory or the executable.
The last section focuses on EDR attacks, which I’ve documented several in this newsletter both in State of the Art & open-source repos. It ends with some tl;drs and advice for red teamers trying to avoid EDR detection, with yet another helpful visual :).
January 15 Issue
Part 15: Function Type Categories by Jared Atkinson
This is an excellent follow-up post to last week's gem, the EDR compendium. You have a good idea (hopefully) of how Windows internals work alongside EDR, and now you can write much deeper OS and API call detections. If not, read on.
In Jared's part 8 blog, he mapped out how to map out tool graphs and function chains to circumvent and build detections. It was quite eye-opening seeing all the combinations of various Windows API calls that can achieve the same function but using a different API call within the chain:
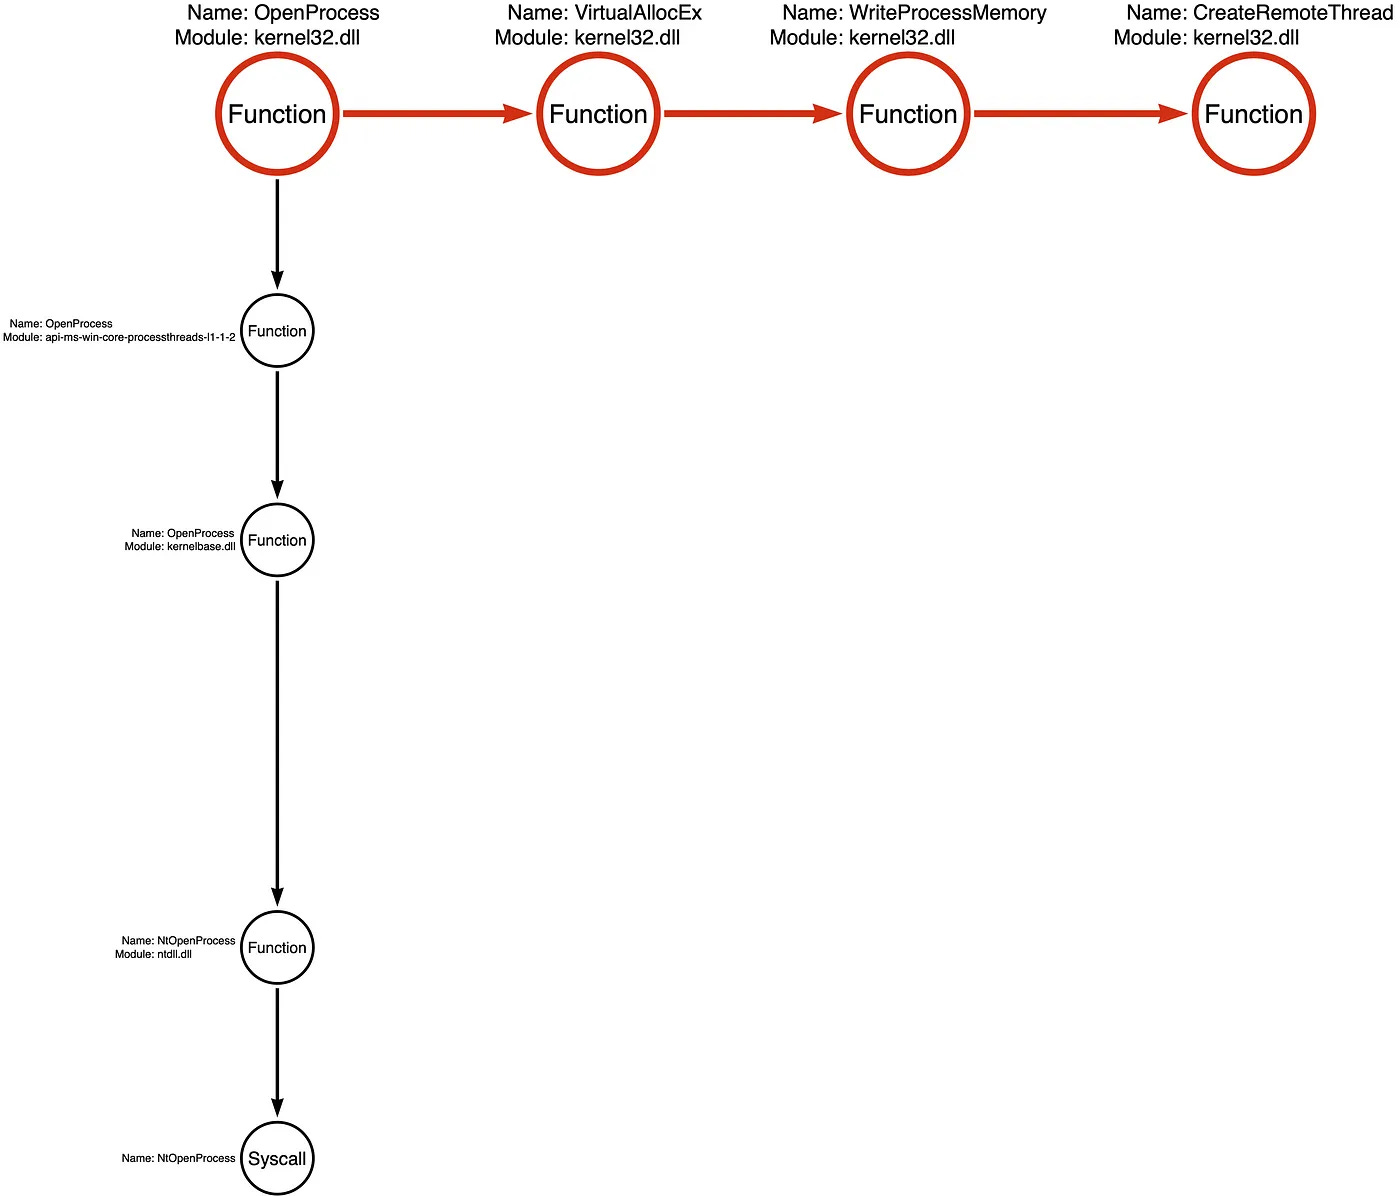
So, this blog post helps readers build these tool graphs by classifying types of functions based on his research into the heuristics of the kinds of functions inside Windows. Once you pick a function chain like the one listed above, you can pick out a "critical function" that is necessary to achieve the function chain. So, when reversing a malicious binary and isolating the critical function, you can identify the parameter signatures in the lowest level function to try to "catch" the specific technique at it's most critical level.
The crazy thing I find about Windows is the amount of indirection DLLs use when interacting with various APIs. As far as I can understand (and I hope folks like Jared can correct me), this is a combination of backward compatibility features and a security precaution. Unlike Linux, Windows wants a hard boundary between user-mode and Kernel-mode operations, and this does set up detection opportunities if you can capture all the combinations.
January 23 Issue
VMware ESXi Logging & Detection Opportunities by Nathan Burns
ESXi is a critical infrastructure technology for many firms and organizations running an on-premise environment. A local hypervisor that can help manage everything from websites, mail servers, and Active Directory without paying astronomical costs to cloud providers can be a cost-effective alternative for many IT admins. The problem is that it can serve as a control plane over all of your internal critical services. To complicate things, it's a Linux environment, and according to Broadcom, "..is not a General Purpose computing environment," which sounds like they don't want to support AV or EDR.
That being said, there are many detection opportunities with out-of-the-box tools in ESXi, and Burns brings the receipts. I linked their ESXi Testing Toolkit last week and missed this post (sorry!) But it's a gem because it's one of the most complete breakdowns of logging sources, system internals, and detection opportunities I've ever seen for ESXi. There's typical host-level logging in usual Linux suspects like auth.log, but Burns showcases several other sources that leverage undocumented (?) SOAP API and ESXi-specific command line tools
I'd love to see an eBPF agent over this so people can get some form of EDR on top of ESXi, but it sounds like Broadcom doesn't want to support it, so it's up to organizations to implement it.
January 29 Issue
Reverse Engineering Call Of Duty Anti-Cheat by ssno
Whenever I see an anti-cheat research blog post, I must include it in an issue. There's so much back-and-forth between cheat developers and anti-cheat staff at gaming companies. I still believe that EDR vendors pay special attention to cheat developers and talk regularly to anti-cheat folks because new techniques that bypass anti-cheat almost always directly apply to EDR and malware development.
One clever part of this write-up is how anti-cheat software detects overlay visuals in the game. The tl;dr is that you can "see through a wall" by drawing an obvious green box on another player's model, giving you x-ray vision and an unfair advantage in the game. The hard part is differentiating graphics over games using legitimate Streaming or Voice Comms tools. The clever part of the anti-cheat is they detect overlay windows across Windows and save the process, memory, and all, to upload to the anti-cheat backend for further analysis.

The last part I'll call out here is how the anti-cheat engine monitors Network Traffic. A common approach cheat devs use to hack these games is to inject shellcode directly into the game process and start a TCP server to send and receive data. ssno did not get into too many details of why this is an approach; I’m guessing it's a lightweight way to obscure the cheating software outside the process or computer. The command center check loops over the Windows internal TCP table owned by the current process (the game) and checks each entry for a client/server connection to an IP port outside the process; it’ll then kill the process.
February 5 Issue
Offensive Kerberos Techniques for Detection Engineering by Noah H.
Windows Authentication via Active Directory (AD) is such a rabbit hole. Besides understanding the internals of the Windows operating system and the Microsoft ecosystem, you now have to understand the implementation of the Kerberos protocol. MIT researchers built Kerberos in 1988 (!), actively replacing NTLM as the preferred authentication scheme for AD-connected clients and applications.
It’s also one of the most abused protocols in a victim environment, as an attacker attempts to laterally move and privilege escalate to the keys of the kingdom, the AD server. There are a ton of published red-team articles on how to perform these attacks. Still, this article by Noah is my favorite one on the subject for two reasons: it’s a compendium of attacks with detailed explanations, and there are detection opportunities!
I wonder how much-sunk cost Microsoft has put into supporting this ecosystem in a backward-compatible way. I think of modern authentication and authorization protocols like OAuth and appreciate the simplicity of accessing microservices in a much more.. sane way.
February 12 Issue
Detection engineering at scale: one step closer (part two) by Guillaume C., Erwan Chevalier and Sekoia TDR
This blog post is Part 2 of Sekoia’s “Detection Engineering at Scale” series. Part 1 is an interesting read, so go check it out if you can, but I thought this Part 2 post was much more technical and helpful. If you’ve ever been in a situation where you want to set up a detection engineering function, this post can serve as a super useful reference tool for setting up guardrails in your detection-as-code strategy.
Maturity matrices are excellent, and I’ve linked several of them in the past, but explaining how you’ve built out parts of the matrix is a great way to communicate the maturity of your organization. Here’s an example of how Sekoia sets up their detection-as-code pipeline:

There are two particular parts in the four boxes underneath “Documentation” that I rarely see people write about, and I’m glad Sekoia covers them. Tests with collected events after re-parsing and tests with collected events are the most important things you can do to check for rule AND telemetry drift. It’s the Acceptance Test part of detection rules.
The documentation-building pipeline is also excellent. You can see the example they link here, and it’s extensive. I love seeing posts about the actual DevOps part of detection-as-code!
February 26 Issue
2025 State of Detection Engineering Report by Anvilogic and SANS
The State of Detection Engineering Report is a comprehensive survey of hundreds of detection engineers on how their threat detection programs function at their jobs. My friends at Anvilogic partnered with SANS to ask all kinds of detection questions, collate the responses, and get some great insights from them. It’s a free survey, so you don't have to sign up for access. It’s super easy to read and comprehend, and it looks great, too.
One thing you’ll notice is the sheer number of quotes from Detection Engineers in the field, many of whom have been featured in this newsletter (by the way, I’m in there, too). The two spots I had a quote listed revolve around detection-as-code and behavioral detections.
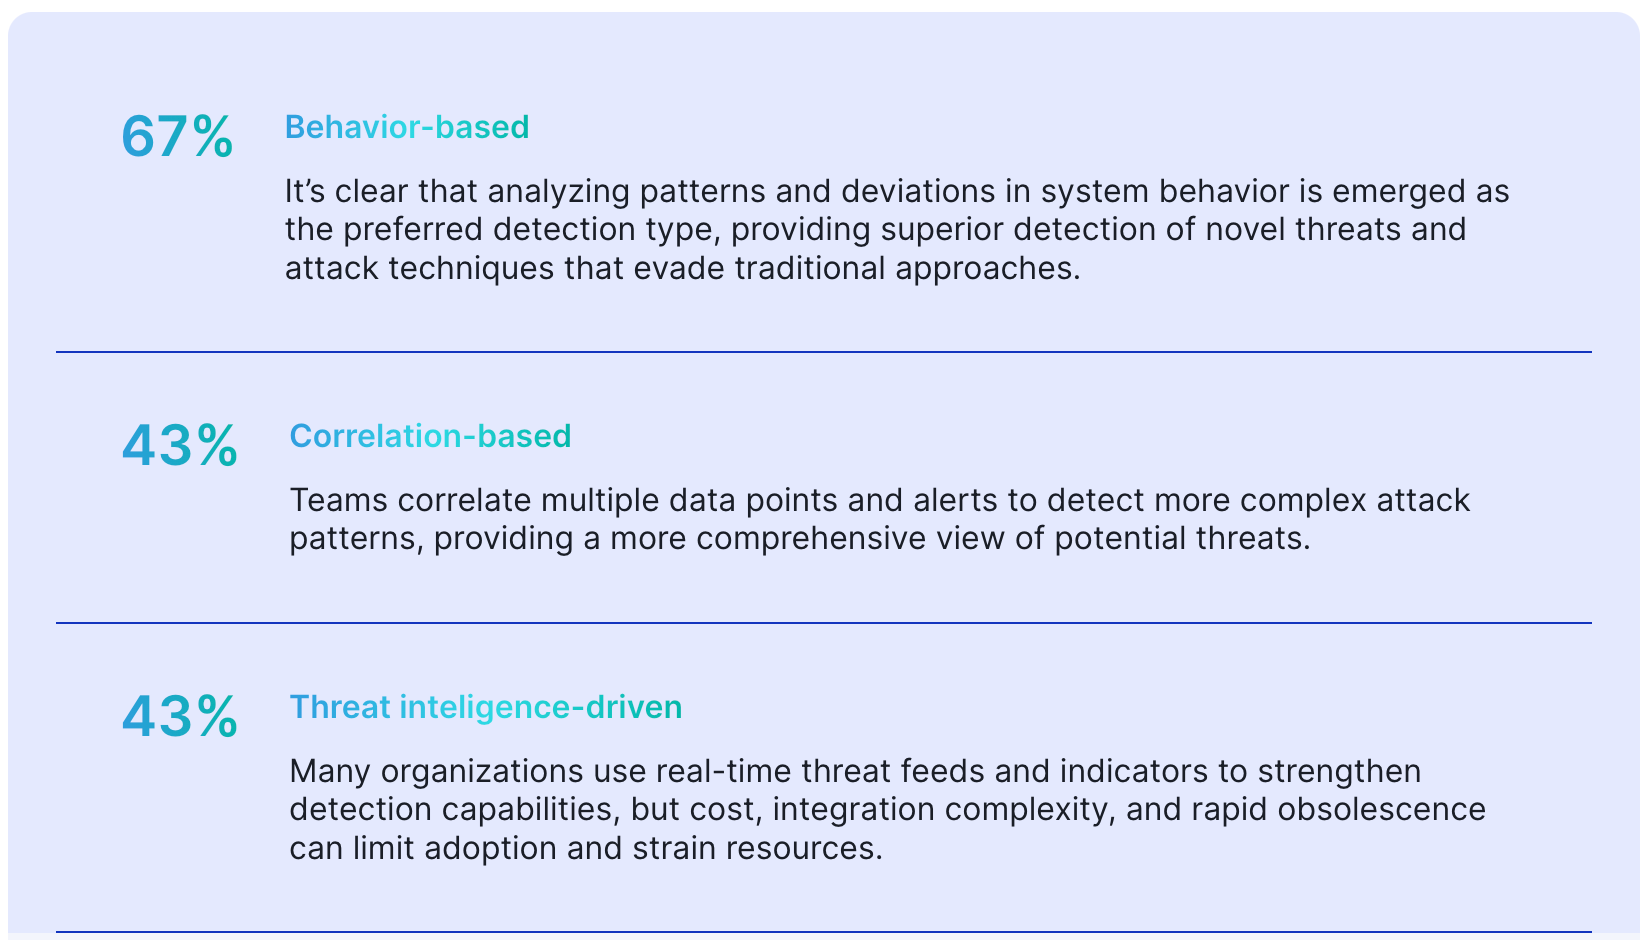
I’m sure, at this point, all of you are sick of me talking about these two topics, but it’s important to emphasize resiliency in finding badness and getting your code into a production system. It was cool to see these themes come to the surface, and I hope you all take some time to read through this and participate next time so we can get even better data!
March 05 Issue
DIY — Evaluating AWS Native Approaches for Detecting Suspicious API Calls by Adan Alvarez
I don’t think I’ve ever read this type of detection engineering type of blog before. I enjoy survey-type blogs, not surveys like the ones you send out and people fill in answers, but a study of methodologies. In this post, Alvarez investigates different ways to set up alerting pipelines in Amazon AWS and compares and contrasts the various detection strategies. Each strategy he investigates documents Ease of Use, Time to Aler,t and Pricing. There are things you can expect, such as CloudTrail. Still, you start to see the complexity of scaling out an AWS environment with multi-org and multi-availability zone logging strategies.
This strategy was pretty interesting:

Basically, you can convert CloudTrail logs to Metrics using AWS’s native observability technology, CloudWatch. Imagine converting 100 separate CloudTrail logs to a counter of just “100”, and you can see a line graph moving up and down based on time. This is a great way to alert on spikes in logs, for example, someone getting access to your AWS account and spamming API calls to see what they have access to. You set a threshold, like 50, and receive an alert whenever that threshold is met.